|
3d localization of epileptiform activity focus in the frontal area 
The screen during tracing. Found dipoles are displayed on head cuts 
The picture shows the results of three-dimensional localization of EEG fragments with focal manifestations of epileptiform activity in left temporal area. Dipole "cloud", which characterizes left-temporal focus of abnormal activity, is displayed on head cuts and 3D image of a head. Topographic maps of initial and reconstructed potentials distribution are very similar, which indicates a high degree of the results and selected model validity. 
Specification of source location for localization for by several EEG fragments confirms the correct selection of EEG fragments and the location of the source of abnormal electrical activity. Localization results for one selected fragment. 
Specification of source location for localization for by several EEG fragments confirms the correct selection of EEG fragments and the location of the source of abnormal electrical activity. Localization results for three selected fragments 
Numerical evaluation of the localization accuracy in the form of a table with initial and reconstructed data 
Graph of change in accuracy and energy, dipole motion path 
The zoomed in head cut displays not only dipoles but orientation vectors of dipole sources as well. Position of the point (dipole center) shows the source localization, and the vector length and direction – its intensity and spatial orientation. 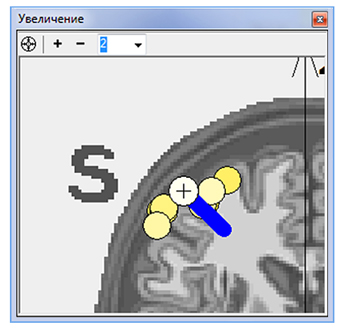
Visualization of different spatial areas of the brain (central, temporal, occipital, etc.) 3D visualization of spatial areas 
Visualization of area borders on the head projection 
An example of EEG fragment localization with the electrooculgoram influence taken into account. Not only the EOG source, 
An example of EEG fragment localization without the electrooculgoram influence taken into account.
Source in the occipital area associated with the alpha rhythm 
Dipole localization confirms that in solving cognitive tasks the frontal-central area of the cerebral cortex is the most active one. 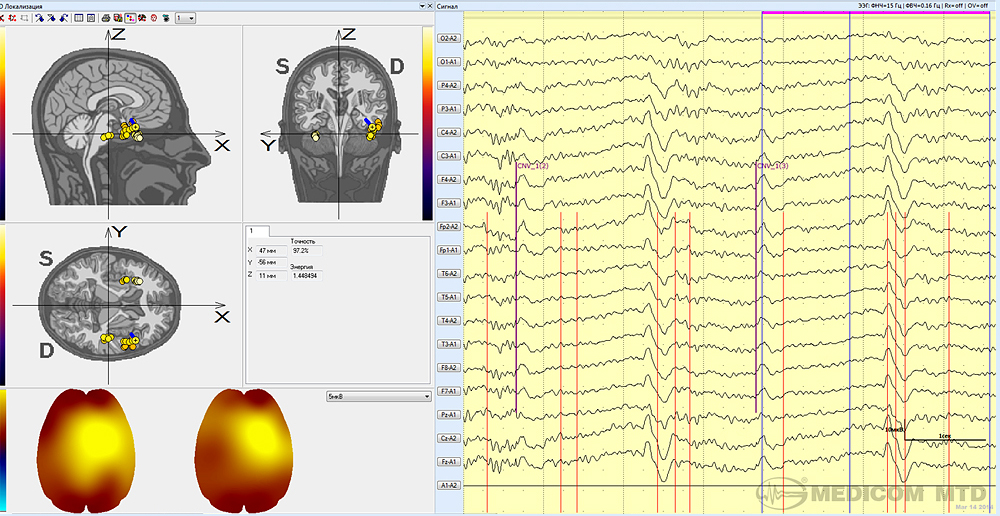
Examples of localized dipole motion path during the EP P300 study at the moment of stimuli recognition and decision-making. 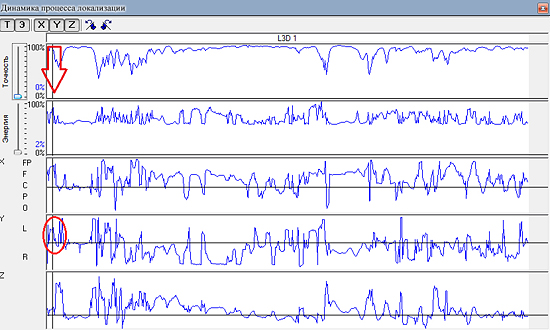
1. The left hemisphere is active at the stage of clicks recognition 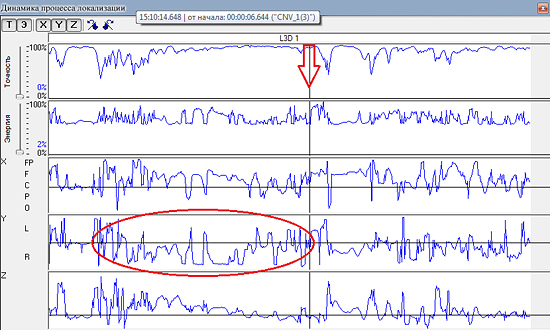
2. The left hemisphere is active in at the moment of stimuli recognition and decision-making 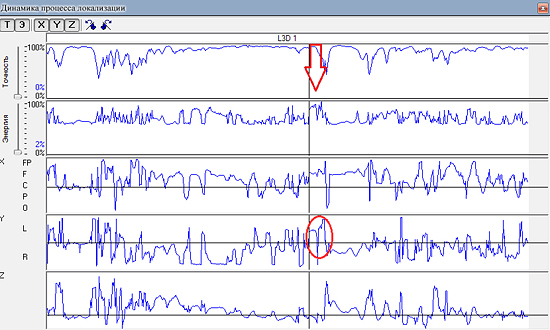
3. The right hemisphere is active while waiting for a decision-making before probabilistic stimulus presentation 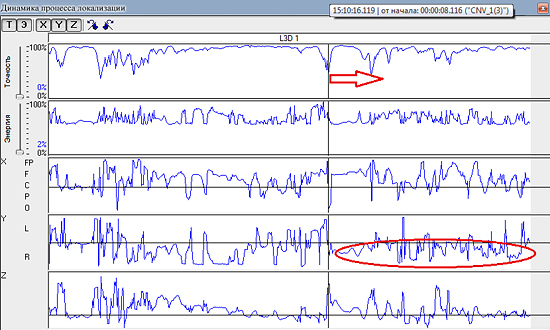
4. The right hemisphere is active after the decision is made At the left: localization of EP responses to a significant stimulus (frontal area). At the right: localization of EP responses to an insignificant stimulus (parietal area). 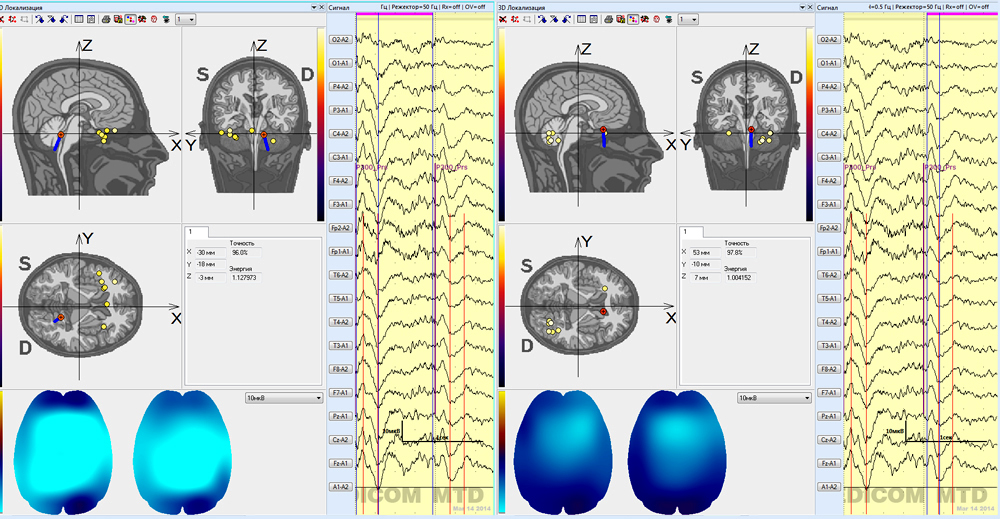
|