Ergonomic interface Ribbon of вАЬEncephalanвАЭ software
Medicom MTD. Medical equipment for electrodiagnosis, rehabilitation and research
Phones: +7 (8634) 62-62-42, 62-62-43, 62-62-44, 62-62-45.
www.medicom-mtd.com
Software for electroencephalograpical studies "Encephalan-EEGR"
All types of main software for electroencephalograpical studies are included in powerful software system "Encephalan", which has absorbed the results of professional work of our programmers, engineers and methodologists, as well as many years of experience in clinical practice in various medical institutions in our country and abroad, from leading clinics and scientific medical centers to the central district hospitals, polyclinics and private medical practitioners.
Modifications of the main software for electroencephalograpical studies of "Encephalan" software system are software "Encephalan-EEGA", "Encephalan-EEGR" and "Encephalan-CFM". They take into account the specific features of implementation and application of equipment manufactured by Medicom MTD Ltd., have user-friendly interface "Ribbon" and work with different Windows versions (XP/7/8).
Main software for electroencephalograpical studies provides visual signal analysis, split mode, contiguous measurement of electrode impedance and potentials, stimulation control, referential reconstruction of EEG derivations, automatic suppression of artifacts, automatic search of non-stationary fragments and epileptiform activity, spectral and amplitude topographic mapping (2D,3D), calculation of coherence, autocorrelation and cross-spectrum function, export and import of data into EDF, UDF, ASCII, EEG study protocol generation, etc.
Software for electroencephalograpical studies "Encephalan-EEGR" ("Elite" variant) is integrated into portable telemetric electroencephalographs-recorders "Encephalan-EEGR-19/26" main modification and electroencephalographs-recorders "Encephalan-EEGR-19/26" "Mini" modification.
The software provides multichannel, multifunctional studies with EEG (up to 32 channels and 64 digital derivations) and data record from wireless devices and sensors (the total number of recording channels is more than 45).
Studies are carried out in telemetric mode with data transmission to the personal computer via Bluetooth¬Ѓ, autonomous-telemetric mode with backup data copying on internal memory card or autonomous (ambulatory EEG, EEG-Holter) mode with data record onto memory card.
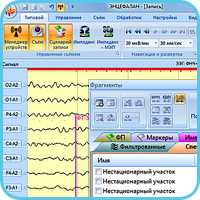
Ergonomic interface "Ribbon" similar to MS Office 2007/2010 interface allows forming command groups for implementation of EEG-studies according to purchased software and assigned tasks.
Basic components of the main window: 1. Heading. 2. File manager and Quick Access Bar. 3. RibbonUI with tabs where the commands are grouped. 4. Windows вАУ one of the additional EEG applications. 5. Vertical tab for temporarily minimized active window. 6. Signal window with amplitude-time grid. 7. Channels panel - tracks. 8. Context menu. 9. Status bar.
Recording and visualization with high resolution of up to 64 digital EEG derivations, software control of phono- and photostimulation.
Channels configuration (up to 45) includes a list of types of channels and their quantity, as well as the signal filter settings individually for each channel (HPF, LPF, rejector).
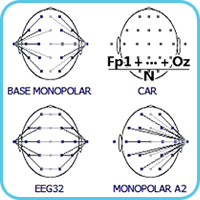
EEG montages are stored in a special expandable library (over 40 montages). The montage editor allows changing the existing montages or creating new ones. Virtual (with the option of returning to initial state) montage changing is available both during EEG recording and analyzing.
The record scenario determines the sequence of hardware and software functional tests, as well as the configuration of stimulators.
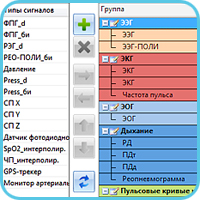
Channel grouping with an option of changing the sequence of channels on the screen with highlighting
Study profile library includes common profiles of the study carrying out, including the channels configurations, the montage and record scenario. There is an option of changing profiles and creating new ones.
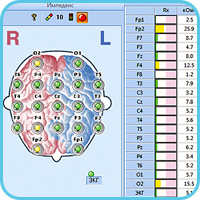
Impedance and potentials (DCp) control during electrodes attachment. The values are recorded along with the EEG during real time record and used for subsequent analysis.
Using the "microscope" tool, you can view any signal zoomed in, measure its amplitude on selected fragment, and also estimate the frequency characteristics of a signal.
Manual and automatic setting of markers of various types while EEG recording, performing tests and subsequent analysis. Markers set during the study are displayed on a special list indicating the type and time of setting. The selection of the marker allows the user to visualize the corresponding fragment for analysis.
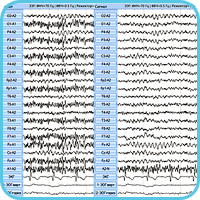
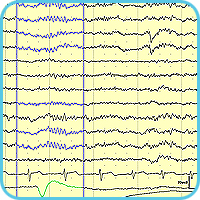
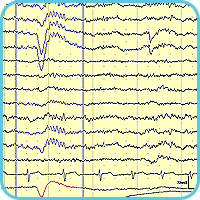
Split mode demonstrates: on the left вАУ artifact from A1 reference in the left hemispheres channels, on the right вАУ elimination of artifacts by applying "–Ь–Њnop–Њlar A2" montage.
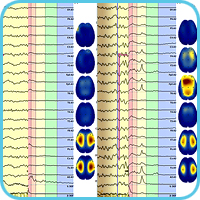
Viewing in split mode and comparison of power spectrums (graphs and maps) of fragments of background record and hyperventilation.
Split mode (splitting screen into 2 or more parts) allows viewing data of one study (the one part may demonstrate the current record process, the other one вАУ previously recorded EEG), or several studies, including an option of presenting results and their math analysis in various forms.
The application supports 2 or more monitors, which allows distributing visual information in the most optimal way for effective EEG study. The main monitor displays native signals, others вАУ results of math analysis in different forms, trends, video from cameras (up to 4), etc.
EEG study carrying out control from a remote computer via Ethernet.
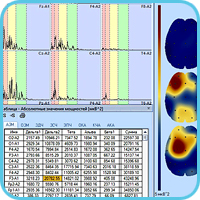
EEG spectral analysis of signals by all derivation in topical presentation, in the form of topographic maps and table values.
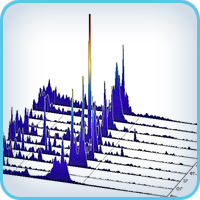
Presentation in pseudo-3D the succession of spectra graphs, which correspond to fragments of EEG study with selected time quantum or to succession of various FT for visual analysis.
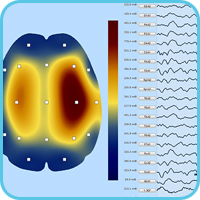
The figure illustrates measurement of amplitude EEG values and topographical 2D mapping of amplitude range (by length of curve, by normalized area)
For EEG analysis, the most common mathematical treatments are applied: power, amplitude spectrum; cross-spectrum, coherence function, auto- and crosscorrelation with the formation of the tables of quantitative parameters and topographic mapping.
Mathematical processing can be performed for the selected EEG fragments of various duration or required frequency range.
Automatic detection and marking of fragments of non-stationarities or epileptiform activity are performed during recording and EEG processing. Detected fragments are highlighted, saved and available for quick search for expert evaluation.
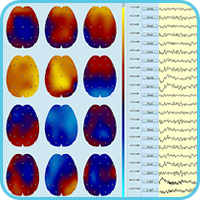
The figure illustrates amplitude 2D mapping of time slices for the purpose of expectative focal expressions detection
Record of ECG, EOG and EMG simultaneously with EEG provides automatic suppression of possible artifacts associated with cardio signal, eye movements and muscle activity.
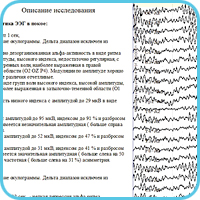
Automatic report generation, based on the description of the selected background fragment and comparison of its characteristics with the selected EEG fragments. There is an option of editing the report and forming neurophysiological conclusion using the function of built-in text editor and a glossary containing common phrases used by a doctor.
Report editor
EEG print options
Convenient preparation and printing of informative EEG fragments, results of processing in
tables and graphs, conclusions on a study with a special Print Manager tool.
EEG records storage
Storage of studies in a database "Cardfile" with a option of export and import of studies, and
archiving of data on a variety of external media. There is an option of arrangement of the
"Cardfile" database in the network on a dedicated server.
Viewing study results on any computer (without installed "Encephalan" software)
Specialized application "Encephalan-EEG-Viewer" is uploaded onto any external data storage
in addition to recorded EEG study for results exchange among specialists and to hand out the
results to the patient in order to get an independent medical consultation or prepare
presentations and reports, and provides the basic functions for visual analysis of EEG
(viewing data, reference reconstruction, scaling and selecting of EEG signals) on any
computer.
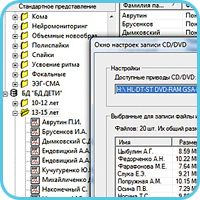
There is an option of creation videos with informative fragments of the study (in common *.avi format), which can be viewed by standard players such as Windows Media or CD/DVD-player.
Software "Encephalan-EEGR" is compatible with another additional software, that expands its capabilities.
![]() "Encephalan-MPA" software for multiparameter analysis of signals from polygraphical
channels in combination with EEG signals (patent RF 2252692) provides calculation and visualization of
trends, which display cardio-cyclic dynamics (averaging from cycle to cycle) of different physiological
parameters of cardio-vascular, vegetative and central nervous systems, which provides visual evaluation
of their interconnection.
"Encephalan-MPA" software for multiparameter analysis of signals from polygraphical
channels in combination with EEG signals (patent RF 2252692) provides calculation and visualization of
trends, which display cardio-cyclic dynamics (averaging from cycle to cycle) of different physiological
parameters of cardio-vascular, vegetative and central nervous systems, which provides visual evaluation
of their interconnection.
![]() Videomonitoring kit for EEG/PSG-video and software "Encephalan-Video"
provide completely synchronized continuous digital record of EEG, audio- and video data, event marks,
analysis and archiving of these data for differential diagnostics of epilepsy.
Videomonitoring kit for EEG/PSG-video and software "Encephalan-Video"
provide completely synchronized continuous digital record of EEG, audio- and video data, event marks,
analysis and archiving of these data for differential diagnostics of epilepsy.
![]() "Encephalan-EP" software for EP-studies вАУ studies of long-latency visual and
auditory evoked potentials, somato-sensory, MMN, CNV, P300 and visual EP for chess pattern.
"Encephalan-EP" software for EP-studies вАУ studies of long-latency visual and
auditory evoked potentials, somato-sensory, MMN, CNV, P300 and visual EP for chess pattern.
![]() "Encephalan-AVS" software suite for EEG and EP studies using audiovisual stimulation
uses different scenarios of cognitive stimulation. Sub-sensory (unconscious) stimuli presentation with
masking and response control is available.
"Encephalan-AVS" software suite for EEG and EP studies using audiovisual stimulation
uses different scenarios of cognitive stimulation. Sub-sensory (unconscious) stimuli presentation with
masking and response control is available.
![]() "Encephalan-3D" software for 3D localization of the electrical activity sources
provides display of nominal source of electric activity on three projections of brain cut in the form
of spatial dipole cloud, which allows localizing focus of EEG epileptiform activity or EP components
source.
"Encephalan-3D" software for 3D localization of the electrical activity sources
provides display of nominal source of electric activity on three projections of brain cut in the form
of spatial dipole cloud, which allows localizing focus of EEG epileptiform activity or EP components
source.
![]() "Encephalan-VLFA" software for analysis of very low frequency activity (patent
RF 2252692). Trends of very slow potentials dynamics and topographic maps of instant values and
reactive changes of DC-potentials' level to functional tests carried out allow evaluating indirectly
the cerebral energy exchange and metabolic changes dynamics.
"Encephalan-VLFA" software for analysis of very low frequency activity (patent
RF 2252692). Trends of very slow potentials dynamics and topographic maps of instant values and
reactive changes of DC-potentials' level to functional tests carried out allow evaluating indirectly
the cerebral energy exchange and metabolic changes dynamics.
![]() Analysis of functional brain asymmetry вАЬEncephalan-FBAвАЭ provides visualization
of intercentral connections maps by calculating the reciprocal functions (cross-correlation,
cross-spectrum, coherence function) for the diagnosis of inter-and intracortical violations,
detection of pathological activity, treatment monitoring, studying topical peculiarities
and intra interaction while doing different activities.
Analysis of functional brain asymmetry вАЬEncephalan-FBAвАЭ provides visualization
of intercentral connections maps by calculating the reciprocal functions (cross-correlation,
cross-spectrum, coherence function) for the diagnosis of inter-and intracortical violations,
detection of pathological activity, treatment monitoring, studying topical peculiarities
and intra interaction while doing different activities.
![]() "HRV" software for heart rate variability analysis for evaluation of VNS and
neurohumoral regulation of a patient in initial (background) state and considering vegetative response
to provoking actions. Provides the evaluation of adequacy of physical and psycho-emotional stresses,
and drugs effect and treatment efficiency control.
"HRV" software for heart rate variability analysis for evaluation of VNS and
neurohumoral regulation of a patient in initial (background) state and considering vegetative response
to provoking actions. Provides the evaluation of adequacy of physical and psycho-emotional stresses,
and drugs effect and treatment efficiency control.
![]() "Encephalan-CFM" software for cerebral functions monitoring in ICU and reanimation
provides continuous dynamic analysis of amplitude-integrated EEG (aEEG) to detect perinatal asphyxia
and epileptiform activity in neonatology, and for neurophysiological control in ischemic strokes and
unconscious post-comatose states.
"Encephalan-CFM" software for cerebral functions monitoring in ICU and reanimation
provides continuous dynamic analysis of amplitude-integrated EEG (aEEG) to detect perinatal asphyxia
and epileptiform activity in neonatology, and for neurophysiological control in ischemic strokes and
unconscious post-comatose states.
![]() "Encephalan-NM" software for neuromonitoring in ICU and reanimation is designed
to calculate and visualize trends (time quantum duration from 10 to 300 sec) of different physiological
parameters of CNS, VNS and cardio- respiratory system in one time scale. Software gives information in
digital and graphic forms to evaluate the state of a patient.
"Encephalan-NM" software for neuromonitoring in ICU and reanimation is designed
to calculate and visualize trends (time quantum duration from 10 to 300 sec) of different physiological
parameters of CNS, VNS and cardio- respiratory system in one time scale. Software gives information in
digital and graphic forms to evaluate the state of a patient.
|
Phones: |
Frunze str., 68, Taganrog, |
| © 1997-2024 Medicom MTD Ltd All rights reserved | |
